
 Watch
Watch One of the most common strategies that proprietary desks globally use when it comes to options trading is spreads. Easy to construct and trade, these two-legged strategies account for the lion’s share of strategy for professional traders.
There are two types of spreads that are deployed by traders – horizontal spread and vertical spread. The nomenclature is decided on the options that are taken to construct the strategy.
In the case of horizontal spreads, two options, either call or put, are selected from different strikes. In a vertical spread, the two options selected are from the same underlying asset and the same expiry date but different strike prices.
While horizontal spreads are constructed mainly to capitalise on a non-directional trade, vertical spreads are created to benefit from a directional move.
Let’s take a closer look at vertical spreads in this article.
Vertical Spreads
There are four basic vertical spreads that are used to capture the two directions – bullish and bearish. These spreads are created by various combinations of calls and puts.
The four vertical spreads are:
• Bull Call Spread
• Bear Call Spread
• Bull Put Spread
• Bear Put Spread
Since these are spreads, they have defined risk and defined reward. Being defined as risk, these strategies can be created using low margins.
In a vertical spread, a trader takes two trades simultaneously – buying one option and selling another of a different strike but the same underlying asset and same expiry.
The vertical bull spreads are created when the trader expects the market to rise. Bear vertical spreads benefit when the underlying security falls.
Construction
Each spread is created by either calls or puts. Thus, buying and selling that happens in the creation of a spread is either buying and selling of calls or buying and selling of puts.
Depending on which leg is bought and which one is sold, the vertical spreads are further divided into credit and debit spreads.
Credit and debit spreads get their name from the trader’s point of view. If, in a strategy, the trader sells an option of Rs 150 and buys another of Rs 50, then he receives a credit of Rs 100 (Rs 150 from selling is credited and Rs 50 is debited). Such a trade is a credit spread.
On the other hand, if a trader buys an option of Rs 200 and sells another one at Rs 120, there is a debit of Rs 80 (Rs 200 debit for buying the option and Rs 120 credit for selling the option).
Let’s now look at the first two types of vertical spreads.
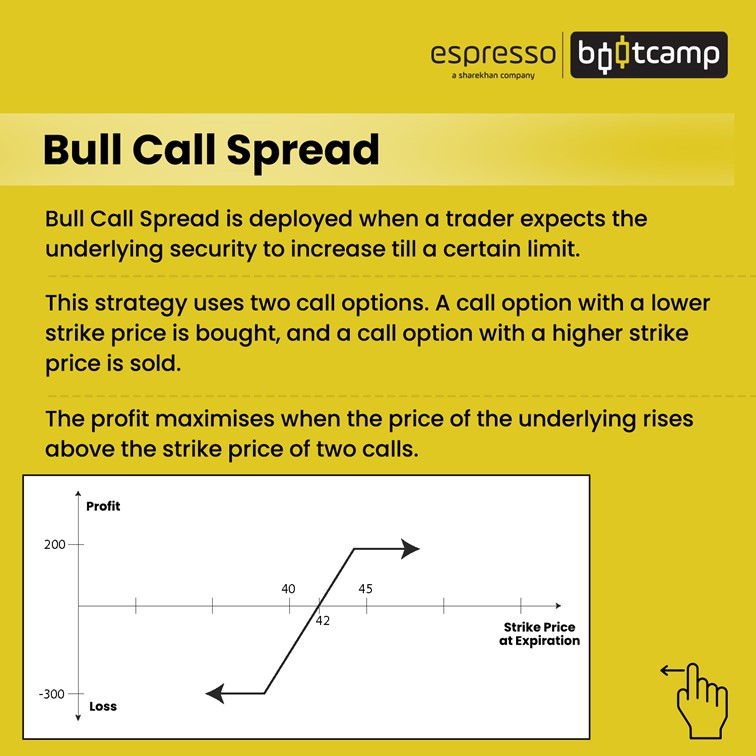
Bull Call Spread
In bull spreads, a Bull Call Spread is created by buying a call option and selling another call option of the same underlying asset and expiration date but with a higher strike price.
Since the call option bought is cheaper than the call option sold, this is a debit spread.
The following diagram represents the payoff chart of a Bull Call Spread.
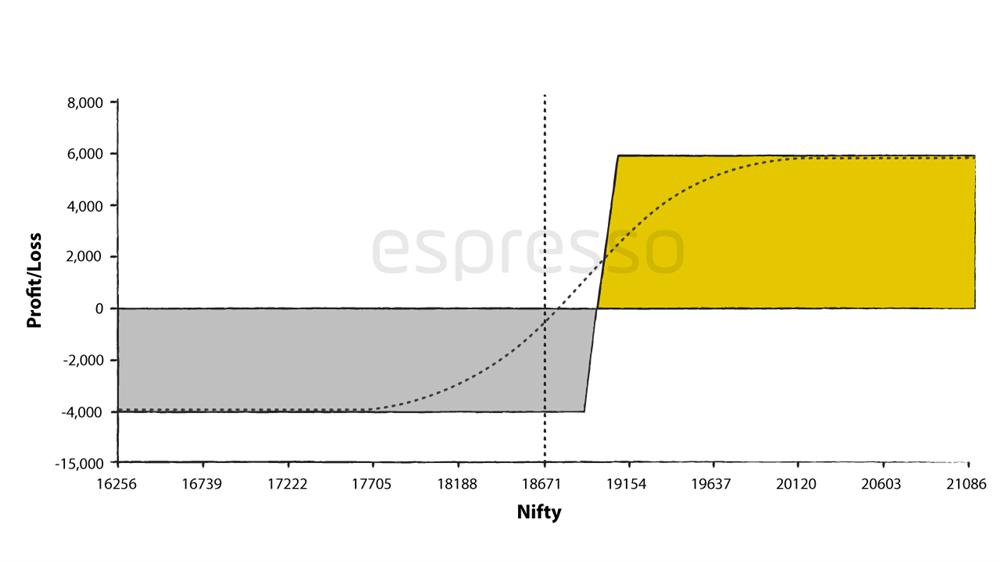
The spread is constructed by
Buying 18900CE Nifty of 29DEC for 182.2
Selling 19100 CE Nifty of 29DEC for 100.7
Net debit in the trade = 100.7-182.2=81.5
On a per lot basis, this works out to Rs. 4,075
This amount is also the maximum loss for the strategy.
The maximum loss is restricted to the net premium paid.
The maximum profit is equal to the difference in the strike prices and the net premium
= 19100-18900-81.5=281.5
On a per lot basis, this works out to Rs 5,925.
Notice the margin required to create the Bull Call Spread is Rs 18,696..
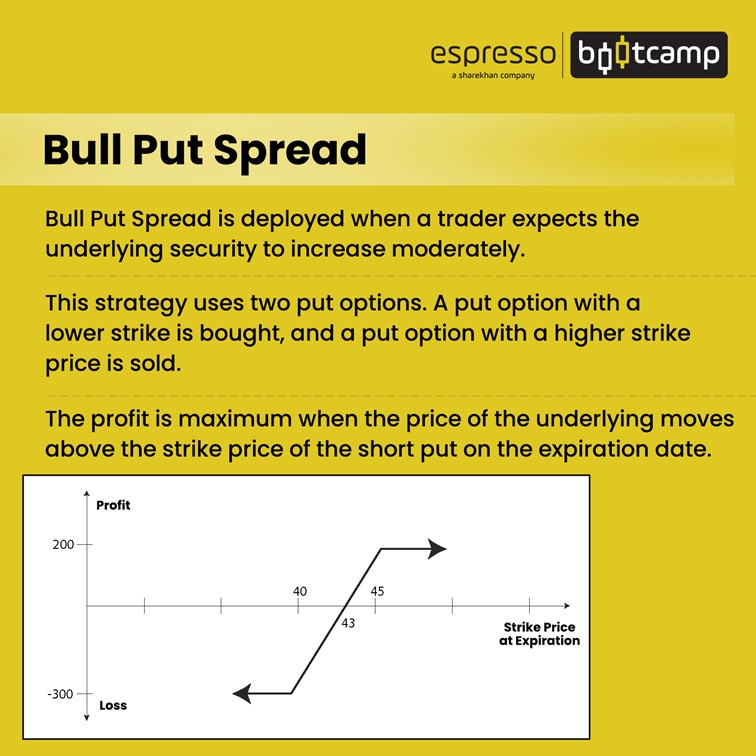
Bull Put Spread
In bull spreads, a Bull Put Spread is created by selling a put option and buying another put option of the same underlying asset and expiration date but a lower strike price.
Since the put sold is of higher value than the put bought, the strategy is a credit spread.
Since this is a credit spread, the maximum gain is restricted to the net premium received for the position, while the maximum loss is equal to the difference in the strike prices of the puts less the net premium received.
The following diagram represents a payoff diagram of a Bull Put Spread.
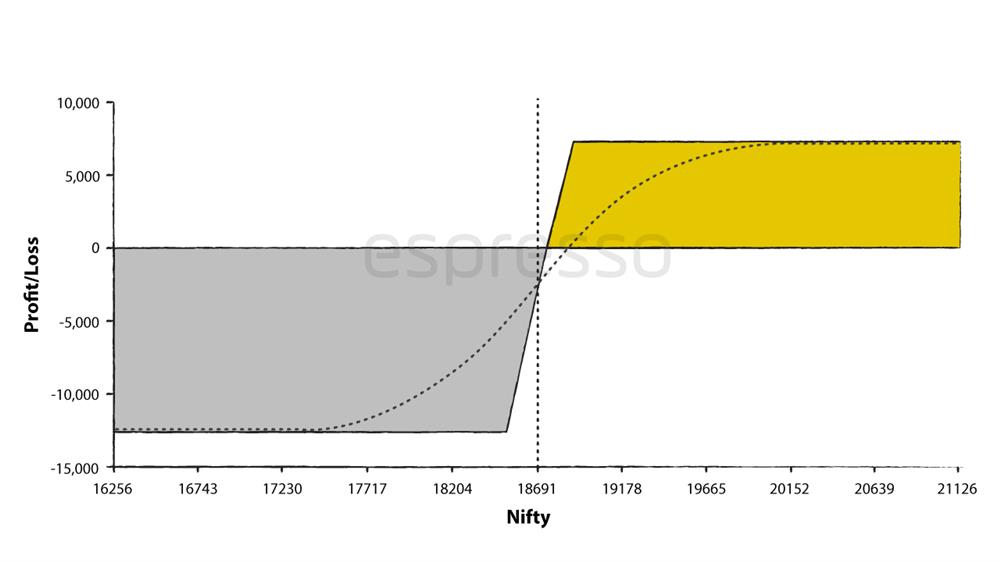
The spread is constructed by
Buying 18,500 PE Nifty of 29DECexpiry for 119.6
Selling 18900 PE Nifty of 29DEC expiry for 266.5
Net credit in the trade = 266.5-119.6=146.9
On a per lot basis, this works out to a net credit of Rs 7,345.
This amount is also the maximum profit for the strategy.
The maximum gain is equal to the net premium received.
The maximum loss is equal to the difference in the strike prices and the net premium
= 18900-18500-146.9=253.1
On a per lot basis, this works out to Rs 12655.
Notice the margin required to create the Bull Put Spread is Rs 33,724
In the next chapter, we will discuss the other two vertical spreads: the bear call spread and the bear put spread. We will also discuss which strategy suits the market environment better.
Points to remember:
- Spreads have defined risk and defined reward.
- The bull call spread involves selling one call option and buying one call option.
- The bull put spread involves selling one put option and buying one put option.
- In bull spreads, the bull call spread is a debit strategy while the bull put spread is a credit strategy.
 0
|
0
|
 0
0

